

It’s not enough for your website to exist anymore – it needs to be incredibly fast. The speed of your website can directly determine the success of your business. It doesn’t matter if you have a thriving e-commerce website, a company portfolio, or a viral content blog-your users expect every single page on your site to load instantly. A delay of one second can result in a massive decrease in your conversion rates, higher bounce rates, and a negative impact on your brand reputation.
Google, the most prominent search engine, considers user experience crucial. It even directly uses speed as a ranking factor for both mobile and desktop search. Fortunately, Google offers a robust, completely free tool for all webmasters, developers, and business owners to address web performance challenges: Google PageSpeed Insights (PSI).
Mastering Google PageSpeed optimization is, therefore, an important step toward securing top search rankings and offering a seamless experience for your visitors. In this comprehensive guide, we will show you exactly what you need to know about Google PageSpeed Insights, what the values and audits mean, and how to implement advanced optimization techniques to significantly increase your scores and real-world performance.
What is Google PageSpeed Insights and What Does It Show?
Google PageSpeed Insights is a diagnostic tool that analyzes the frontend and backend performance of a specific webpage on both mobile and desktop devices. When you run a test, you get a detailed report with suggested methods to improve your website’s loading speed, responsiveness, and visual stability.
However, to understand precisely what a Pagespeed Insights report offers, we need to look at its two different data categories: Field Data and Lab Data.
Field Data: How real users see your website
Field data is derived from the CrUX database (Chrome User Experience Report) and includes all user data collected on your website over the previous 28 days. When real users visit your website using Google Chrome, their aggregated performance metrics are collected anonymously and sent back to Google.
- Why is it important? The field data represents how Google views the user experience on your website and determines whether you meet its Core Web Vitals standards. This method takes into account different device speeds, network conditions and actual user engagement.
- The drawback? If your website doesn’t have enough traffic to be properly measured, you will not see any field data displayed and will have to make do with lab data.
Lab Data: Performance testing in a controlled environment
The lab data is generated on the fly during the analysis. Google uses Lighthouse, an open-source tool for improving web page quality. During a lab test, your page’s performance is assessed using standard device features and network settings (usually throttling speed to mimic a mid-range smartphone on a 4G network).
- Why is it important? Lab data can be easily reproduced and is an excellent source of detailed performance bottlenecks and diagnostic recommendations.
- The drawback? Lab data doesn’t account for fluctuating network conditions or real-time user behavior; it represents only a single snapshot of your webpage under defined conditions.
Score, Metrics, and Audits: How to understand your data
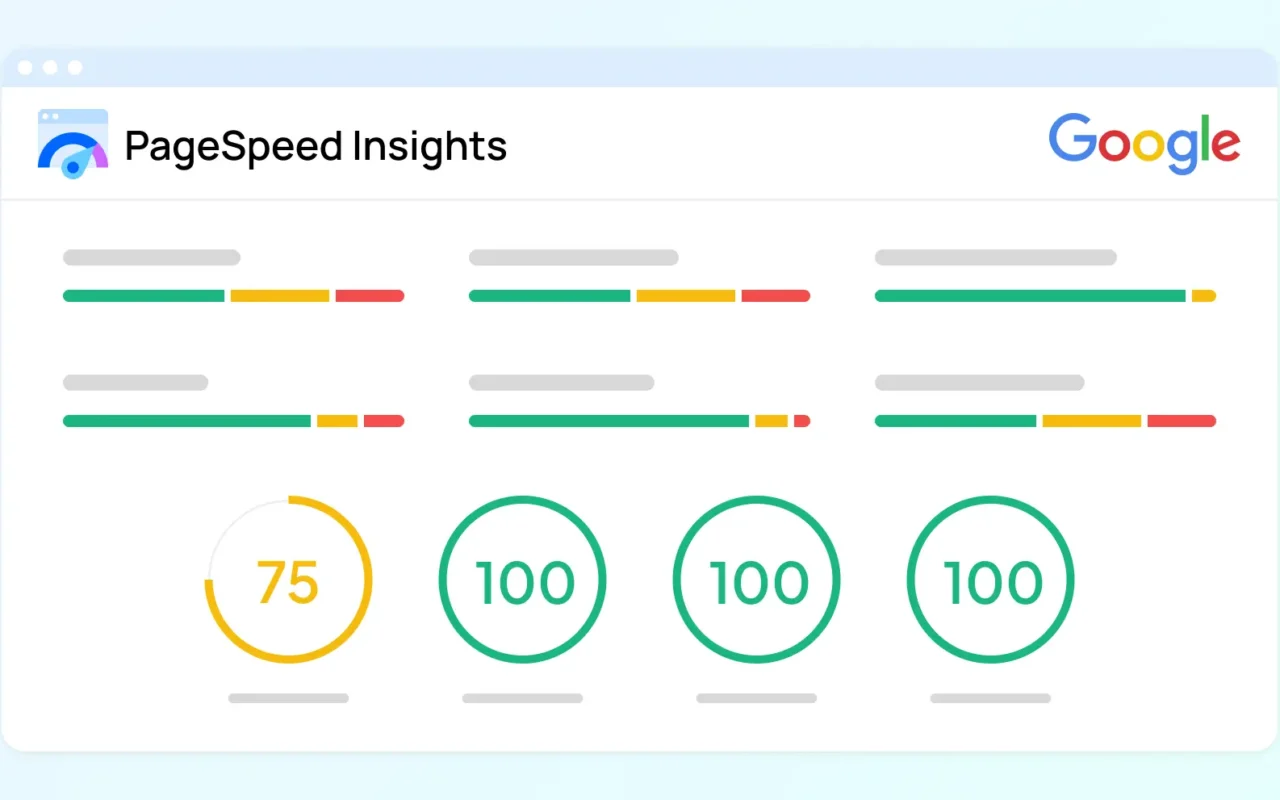
The first item displayed when a report is generated by PageSpeed Insights is your score. This is a colored circle indicating performance from 0 to 100:
- Good (90 – 100): Excellent user experience and optimal performance.
- Needs Improvement (50 – 89): Some performance issues may negatively impact user experience and your search rankings.
- Poor (0 – 49): Serious performance issues are hurting user experience and rankings.
Your score, however, is just an aggregate. To fully take advantage of Google PageSpeed optimization techniques, we need to examine the various metrics and diagnostic audits.
Core Web Vitals
Core Web Vitals are a set of specific, user-centric metrics determined by Google to be critical for excellent web health, focusing on load performance, responsiveness, and visual stability:
- Largest Contentful Paint (LCP): loading performance. This metric measures the time it takes for the largest image or text block in the viewport to load. Ideally, this score should be under 2.5 seconds.
- Interaction to Next Paint (INP): responsiveness. The INP score quantifies how long it takes a page to respond to user interactions such as clicks, taps, or keyboard inputs. An ideal score is below 200 milliseconds.
- Cumulative Layout Shift (CLS): visual stability. This metric measures the total of all layout shifts that occur when unexpected displacements of visual elements happen while the page is loading. An ideal score is below 0.1.
Other Performance Metrics
Beyond the Core Web Vitals, the following additional indicators are provided by Lighthouse:
- First Contentful Paint (FCP): the loading performance of the first DOM elements, such as text or an image.
- Total Blocking Time (TBT): This is the total time between FCP and when your page is ready to accept user input, during which the main thread was blocked, which heavily impacts your Lab Data score.
Diagnostic Audits
Beneath the metrics section, you will also find a list of passed and failed audits. These are the different problems Google has detected in your code, assets, or server configuration. Each audit serves as a checklist for you to follow, prioritizing tasks based on estimated time savings.

Here’s how to fix and optimize your site for PageSpeed
Moving from an abysmal score to a perfect green score is the result of solid engineering. This is a complete guide on what you need to address in your website to achieve top-tier speeds.
1. Image Optimization (dimensions, formats, and deferring)
Images are the single largest part of the page size. Images that have not been optimized lead to slow page speed, large data transfer, and a poor LCP score.
- Serve the correct dimensions – Do not upload a 4000x3000px image to a 400x300px spot on the page. Scaling an image down using HTML or CSS requires the browser to download an unnecessary chunk of data while chewing up CPU cycles to render your image. Crop and resize your images to the dimensions at which they will be displayed before uploading.
- Use modern formats (WebP or AVIF) – JPEG and PNG, two of the oldest image formats on the web, are no longer considered the best choice for all use cases. Switch to newer image formats like WebP or AVIF; these formats use more efficient algorithms to achieve higher compression ratios for your images while maintaining visual quality.
- Use aggressive compression – use image compression tools such as TinyPNG, ImageOptim, or automatically on the server side of your website to remove redundant data and make your image files as small as possible.
- Defer loading images that are not in view (lazy loading) – you don’t need the user’s browser to download all of the images that are located towards the bottom of the page (below the fold) when the page loads initially. Add loading=”lazy” to all of your img tags to lazy load images that are located away from the fold so that the browser is not forced to download them.
2. Use font-display to improve text readability
If you use custom web fonts on your website (e.g., from Google Fonts), the browser needs to download the font file before rendering the text. Often, without specifying otherwise, the browser hides the text until the font has fully downloaded (a flash of invisible text). This negatively affects your FCP score and leaves users staring at a blank screen.
To avoid this, use font-display: swap; in your @font-face rules. This will instruct the browser to immediately display fallback text (e.g., system fonts like Arial or Times New Roman) while it downloads the custom web font. Once it’s loaded, it will instantly swap that in. This will improve FCP and INP and is a requirement for consideration under Google’s accessibility and speed guidelines.
3. Streamline JavaScript and CSS loading
Modern websites contain a lot of unnecessary JS and CSS, which can lead to high TBT and poor INP.
- Minification – This refers to removing all unnecessary data from the source code of your HTML, CSS, or JavaScript, such as whitespace and comments, without changing the functionality of your website.
- Minimize files and counts – Condense your separate stylesheets into a single file, and combine JavaScript files where it makes sense. Identify unused code (dead code) by running coverage audits in Chrome DevTools, then remove code that is loaded but not rendered.
- Minimize JavaScript Execution Time – The page’s rendering time is affected by how much time is spent on the main thread, which heavily uses JavaScript. Keeping your scripts light is key to loading a fast website.
If your looking to get great scores on your website, then you probably don’t want to rely solely on some heavy automated plugin/tool that can often add more to the problem than it’s fixing, so please learn how to speed optimize your website without using a plugin to understand how the natives of the internet optimize on the fly and ensure your website’s performance is always in check.
4. Use Asynchronous and Prioritized Loading
While file size is important, how you load those files also drastically affects page speed. In a default loading scenario, the browser parses the HTML sequentially, pauses on the element it finds, pulls in the JavaScript file, executes it, then continues to the next element, this is known as render-blocking.
- Use async and defer – async loads the JavaScript file in parallel and executes it as soon as it is downloaded, ideal for non-critical JavaScript and third-party scripts (e.g., Analytics). The defer attribute also loads the JavaScript file in parallel but does not execute it until HTML parsing is finished, ensuring the correct execution order.
- Use resource hints – tell the browser what needs to be downloaded prior to what. <link rel=”preload”> is ideal for high-priority resources such as your main stylesheet, hero image, or main navigation bar. <link rel=”preconnect”> establishes early connections to important third-party domains such as payment gateways and font providers before actually sending the request and establishes the necessary connections ahead of time.
5. Optimize the main thread and DOM size
The main thread is the core of the browser where most processing occurs, including parsing HTML and CSS, creating the DOM, and executing JavaScript. If there’s too much going on, the browser will get stuck for the long haul, resulting in an unresponsive website.
- Break down long tasks: Any task that takes more than 50ms is a long task and can make your website unusable while it’s processing. Split it into a couple of separate asynchronous tasks, or offload some heavier calculations to a web worker to prevent blocking the main thread.
- Reduce the size of your DOM – having a huge number of DOM elements can increase the amount of data needed to run CSS calculations, which will significantly slow your website’s rendering. Do not stack dozens of divs within one another; the average website should never have more than 1400 DOM nodes.
- Reduce your overall page weight – your total page weight should never exceed 1.6MB; if you have too much data, your browser will spend more time downloading.
6. Browser Caching and optimized policies
There’s no reason for your website to force users to download your site from scratch on every single visit. Caching static resources will ensure faster load times.
- Use Cache-Control headers: make sure to use them to control how long certain static assets (images, CSS, JS) remain in a user’s browser cache. You should use a high max-age (e.g. Cache-Control: max-age=31536000 for a year) to achieve the best results.
- Use Cache Validation: add ETag and Last-Modified headers to files so the browser can determine whether they are still valid, and you won’t need to download the entire file again if it’s changed.
7. Minimize request counts and eliminate redirects
Each request to the server takes a while to resolve, resulting in long load times. A website that makes over 150 requests per page load is a failure on many levels.
- Combine files – Combine files such as JavaScript and CSS to reduce the number of requests the browser makes for certain asset types.
- Eliminate redirect chains – A chain of redirects (e.g., from http to https to www) is extremely damaging and will cause additional round-trip and delay load time before the user even reaches the content of your website.
The Secret Engine: Server-Side Performance
Optimizations on the frontend, such as compressing images and deferring JavaScript, play an important role, but will get you nowhere if your underlying server infrastructure is sluggish. If your server takes more than a second just to initially respond to a request, your front-end code is delayed from the start. This is measured as TTFB (Time To First Byte).
A bad TTFB infects your entire loading time and will be the downfall of your FCP and LCP scores. To fix this, you will want to optimize your server:
- Improve Hosting infrastructure: Cheap shared hosting plans often get overwhelmed and slow down. Use managed hosting, a VPS, or even your own cloud infrastructure.
- Optimize Your Database: Make your database run faster! Index tables properly, remove large unnecessary overhead entries, and optimize your slow SQL queries.
- Utilize Server-side caching: Cache objects using Redis or Memcached. Store a fully built HTML page in memory to serve your users without requiring complex PHP/database processing every time.
For those who want to tackle the biggest challenge and build an extremely fast website infrastructure to improve your web vitals, see our article on speeding up server response time.
Conclusion
Successfully implementing a Google PageSpeed Optimization strategy requires ongoing vigilance and technical discipline. As you make changes to your website or add new features, performance may slip.

Regularly audit your site with Google PageSpeed Insights, understand the critical user behavioral metrics (LCP, INP, CLS), and rigorously apply both frontend and backend engineering best practices (ranging from next-gen image usage to robust server-side caching), and you’ll be rewarded with a lightning-fast website that not only improves search engine rankings and engagement but ultimately boosts your bottom line.


